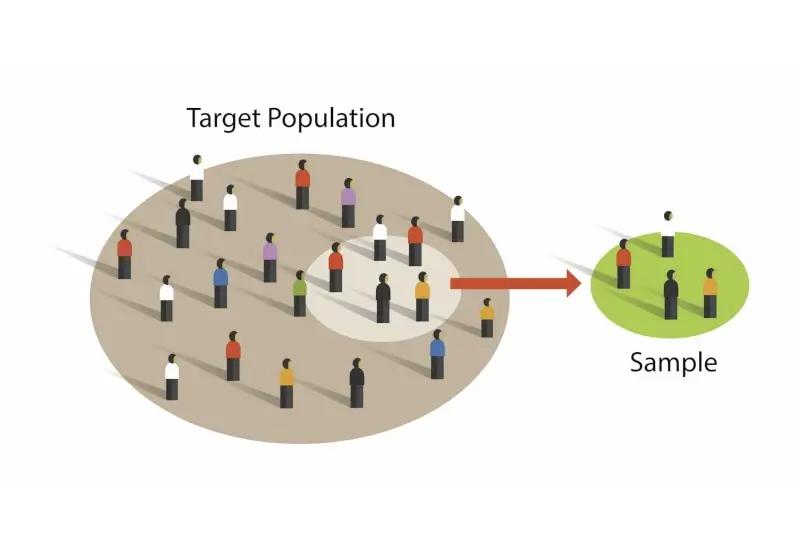
Sample size is one of the most important criteria when it comes to designing an investigator initiated trial. After all, selecting the wrong size can be disastrous for a study later on. It can be quite an intimidating process if you have not done it before but don’t worry. This article will guide you through the basics of calculating the optimal sample size for your clinical study.
Power Analysis
Unlike conventional statistical tests that analyze collected data, we need a predictive statistical tool that can be used before any data is even collected. Power analysis (or statistical power) determines the probability that a test will observe an effect. It is also commonly denoted as (1- β), where β refers to Type II error (false negative). Overall, an increase in sample size will increase the probability that your test will be able to detect a small effect size. The aim, however, is to select a reasonable sample size. If it’s too small, then you won’t see an effect. If it’s too large, then the study becomes too expensive. Fortunately, there are various free online calculators (http://powerandsamplesize.com/Calculators/) that will help you calculate your optimal sample size based on a few key input variables.
Sample Calculations
Comparing 2 proportions: 2-Sample, 2-Sided Equality
One of the most common scenarios is comparing two different proportions. For example, you hypothesize that an eye drop treatment can reduce dry eye symptoms by 10% in your test group. Dry eye affects approximately 85% of people in your control group. What does your sample size need to be in order to have a power of 80% and with a confidence interval of 95%? Based on this information, we can input the following values into a software or an online calculator (http://powerandsamplesize.com/Calculators/Compare-2-Proportions/2-Sample-Equality) to calculate the sample size for the control (nA) and treatment (nB)
pA = 0.85
pB = 0.75
confidence interval (CI) = 0.95 OR α = (1-CI) = 0.05
power (1-β) = 0.80 OR β = 0.2
κ = nA / nB = 1, assuming that the sample size for the control and the treatment group are identical
Zx is the critical value of the Normal distribution at x
Formula:
nA = κnB
nB = ((pA(1- pA)/ κ + pB(1- pB)) ((Z1–α/2+Z1–β))/(pA – pB))2
R code:
| pA=0.85pB=0.75
kappa=1 alpha=0.05 beta=0.20 (nB=(pA*(1-pA)/kappa+pB*(1-pB))*((qnorm(1-alpha/2)+qnorm(1-beta))/(pA-pB))^2) ceiling(nB) # 70 z=(pA-pB)/sqrt(pA*(1-pA)/nB/kappa+pB*(1-pB)/nB) (Power=pnorm(z-qnorm(1-alpha/2))+pnorm(-z-qnorm(1-alpha/2))) |
In this situation, the optimal sample size required in order to observe an effect is nA = nB = 248. In other words, you will need to recruit 248 subjects in your control group and 248 subjects in your treatment group in order to detect a 10% difference with 95% confidence and 80% power. The sample size will vary if you change the input parameters, such as increasing the power or increasing your confidence interval. In addition, this calculation does not factor in confounding variables and dropout rates. For this reason, we recommend that you add in some additional buffer when setting the final sample size for your study.
Test for 1 Proportion: 1-Sample, 2-Sided Equality
Depending on your needs, there are other calculations to determine sample size. In another example, we are interested in evaluating the success rate of a new type of intraocular lens (IOL). The new method is expected to have an acceptable patient satisfaction rate in 85% of the cases compared to the known 75% success rate for current IOLs. What is the sample size needed to have a power of 80% and a 5% type I error rate (95% confidence interval) in order to support this claim? For this particular scenario, we use a one-sample proportion test:
p = 0.85
p0 (reference value) = 0.75
confidence interval (CI) = 0.95 OR α = (1-CI) = 0.05
power (1-β) = 0.80 OR β = 0.2
Zx is the critical value of the Normal distribution at x
Formula:
N = p(1-p)( (Z1–α/2+Z1–β) /(p – p0))2
Online calculator: http://powerandsamplesize.com/Calculators/Test-1-Proportion/1-Sample-Equality
R code:
| p=0.85p0=0.75
alpha=0.05 beta=0.20 (n=p*(1-p)*((qnorm(1-alpha/2)+qnorm(1-beta))/(p-p0))^2) ceiling(n) # 50 z=(p-p0)/sqrt(p*(1-p)/n) (Power=pnorm(z-qnorm(1-alpha/2))+pnorm(-z-qnorm(1-alpha/2))) |
The sample size we would need is 100 subjects in order to determine whether the new IOLs are at least 10% better than current IOLs. If we wanted to determine if the IOLs are at least 5% better, then the required sample size would increase to 502.
Compare 2 Means: 2-sample, 2-Sided Equality
In another example, a surgeon is interested in comparing the improvements in vision following two different LASIK procedures. The current LASIK procedure (group A) is expected to improve vision by an average of 85%, whereas a newer procedure (group B) improves vision by up to 90%. The standard deviation is estimated to be approximately 10%. What is the sample size that is required in order to show a power of 80% and a 95% confidence interval?
uA = 0.85
uB = 0.90
confidence interval (CI) = 0.95 OR α = (1-CI) = 0.05
power (1-β) = 0.80 OR β = 0.2
κ = nA / nB = 1, assuming that the sample size for both groups are identical
Zx is the critical value of the Normal distribution at x
σ = standard deviation
Formula:
nA = κnB
nB = (1 + 1/κ )(σ * (Z1–α/2+Z1–β)/ (uA – uB)) 2
R code:
| muA=85muB=90
kappa=1 sd=10 alpha=0.05 beta=0.20 (nB=(1+1/kappa)*(sd*(qnorm(1-alpha/2)+qnorm(1-beta))/(muA-muB))^2) ceiling(nB) # 63 z=(muA-muB)/(sd*sqrt((1+1/kappa)/nB)) (Power=pnorm(z-qnorm(1-alpha/2))+pnorm(-z-qnorm(1-alpha/2))) |
Online calculator: http://powerandsamplesize.com/Calculators/Compare-2-Means/2-Sample-Equality
Based on the above input values, in order to observe the 5% difference between the two groups, the surgeon will need a sample size of 63 LASIK surgeries for group A, and another 63 surgeries for group B. This sample size will increase if the standard deviation increases, or if the difference between group means decreases.
If you need more help with determining sample size calculations, Sengi provides services to help you draft, design, and review your study designs.
REFERENCES
Chow S, Shao J, Wang H. 2008. Sample Size Calculations in Clinical Research. 2nd Ed. Chapman & Hall/CRC Biostatistics Series. Page 58.


