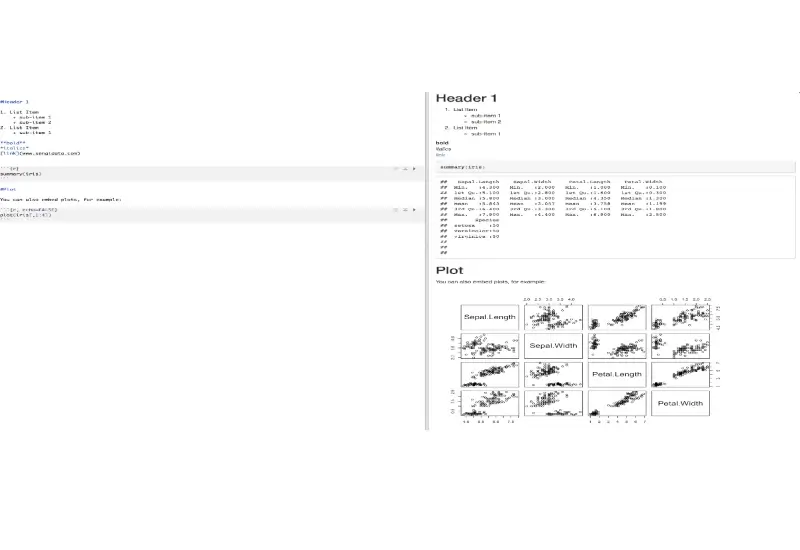
Have you ever analyzed raw data, come back to your analysis months later, and struggled to figure out what you did? The importance of keeping a lab notebook during experiments is often drilled into researchers. However, the same cannot be said for keeping a detailed log of data and statistical analysis.
Whether you use Excel, SPSS, Statistica, R, etc. it is important to keep track of how your raw data was analyzed. At Sengi Data we prefer to use R for a lot of reasons, outlined in another article. R also makes keeping track of your data and statistical analysis, if you use R Markdown.
In this article, we will discuss how to use R Markdown to simplify research.
Markdown
Markdown files contain both text and formatting commands, which are then used to create a formatted document.
R Markdown files, like “regular” Markdown files, contain text and formatting commands, but they also contain R code and results. All of these features are combined to create formatted documents, such as a pdf or html file. In RStudio, this process is called knitting.
The text portion of R Markdown files can be formatted in many ways including 6 header levels, lists, bold, italic, strikethrough, tables, inline equations, and more. RStudio provides a cheatsheet with many options. With the text you can outline what you are trying to do with each portion of inline code or a code chunk.
Inline Code and Code Chunks
When you use R Markdown files, R code is included as inline code or code chunks. When knitted, inline R code will only show the text result of the code, while R code chunks can display both the code and the result. For example:
The value of pi is `r pi`
Will display for inline code as: The value of pi is 3.1415927
& will display for a code chunk as:
![]()
R code can also be used to output figures. Here is an example from our predictive modelling post using the Titanic dataset.
![]()

Knitting
Knitting in RStudio takes the R Markdown file and converts it into a pdf, html, or Word document. With knitting, the R code is run and then the results added back to the text and output in the desired format. In the interest of good scientific practice, the output should be pdf or html files instead of Word documents because pdf and html files are harder and less tempting to make changes to.
Knitted pdf and html files can be saved and accessed easily again. That way, when you revisit or redo your analysis, the knitted files will have the code and your comments to help you remember what you were doing.
Knitted files can also be easily sent to colleagues and coauthors. Rather than sending hard to follow Excel spreadsheets with graphs and statistical analysis haphazardly spread over multiple sheets, use R Markdown knitted files to provide an overview of your analysis that is easier to follow.
Summary
Use R Markdown files to simplify research. They provide an easier-to-follow overview of how and why you performed your statistical analysis. This is especially useful for your future self, colleagues, and coauthors when trying to figure out what was done.


