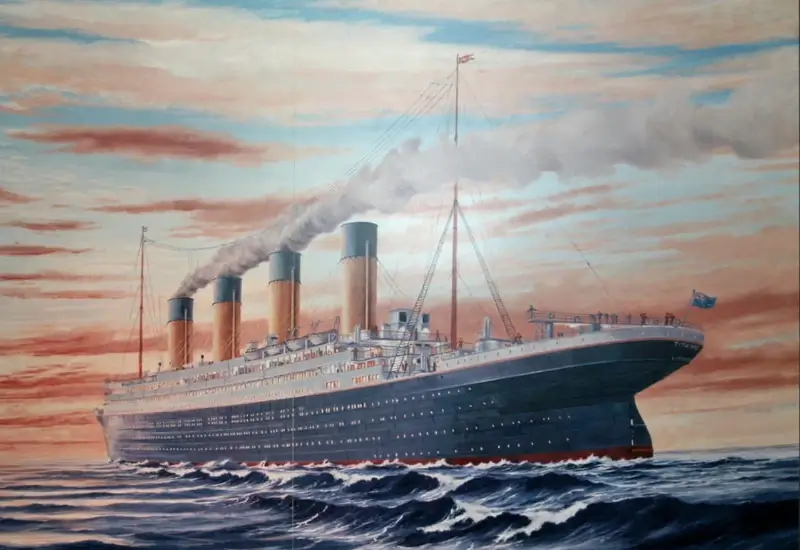
In previous posts, we talked about the advantages of using R, and demonstrated how to a solve brain teaser using R. R is also a powerful tool for predictive modelling. Predictive modelling uses available data and statistics to forecast outcomes. In this example, we use R to predict the fate of passengers on the Titanic.
Background
On April 15, 1912 the Titanic sunk 600km off the coast of Newfoundland. Highlighting this tragedy is the death of 1502 out of the 2224 passengers and crew. We can use R to build a model capable of predicting the fate of the passengers and crew. The data is available from Kaggle for download, and is already split into a train dataset and test dataset.
We will use R and the train dataset to build our model. Details about the train dataset are as follows:

The test dataset contains all the variables in the train dataset, except that we have have to predict who survived ($ Survived). We can submit each of our predictions to Kaggle for scoring.
Gender and Age
“Women and children first.” That might spring to mind when thinking about who is more likely to survive. Here we take a look if that is true. Below is a graphical comparison of gender ($ Sex), age group (child vs adult, $ Age), and survival ($ Survival). It is immediately obvious that males had a higher fatality rate than females. Children were about equally as likely to survive as not, while adults disproportionately did not survive.


Gender and Class
Here we are taking a look at gender ($ Sex), class ($ Pclass) and survival ($ Survival). Glancing at the figure below it is clear that being in 1st, 2nd, or 3rd class affected your odds of survival. Third class passengers fared the worst, especially the males. It is striking that very few females in 1st or 2nd class perished.
![]()

We can see the difference class and gender made on the odds of survival, but how well do those variable alone predict survival? We can choose a simple model, make a prediction, and submit it to Kaggle for scoring.
![]()
Making a simple prediction based on just gender and class is decent enough to earn a Public Score on Kaggle of 0.76555.
Random Forests
We can improve our accuracy using a simple Random Forest model. Random Forests utilize many decision trees to construct a model. We will use all variables excluding the names of the passengers, their tickets, and cabin information. We also need to clean up any missing data. This results in a 0.77033 Public Score on Kaggle.

Next Steps
We have shown how R can be used for predictive modelling, using the Titanic as an example. With further feature engineering, such as parsing out each passengers title, and determining their family size, our score can exceed 0.8.


